
Total Number of Newly Registered Cooperatives

In 2011, the Cooperative Development Authority was able to register a total of 1,894 cooperatives, a 37.6% increase compared to 2010. The NCR posted the highest number of cooperatives registered for the said year with 286 newly registered cooperatives, followed by Region IV with 239 newly registered cooperatives.
Number of Newly Registered Cooperatives
ARMM registered 235 new cooperatives in the region in 2011, which is 658% higher compared to last year’s figures. It is then followed by NCR with 129% increase.
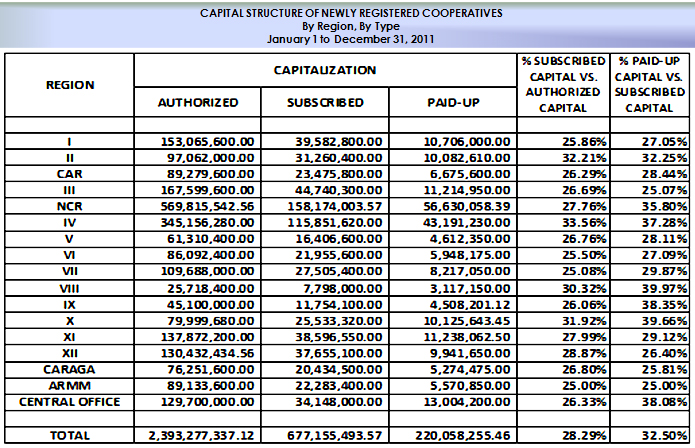
Credit cooperatives contributed the largest number of new registrations (522) compared to other types.
The National Capital Region has the most number of cooperatives registered in 2011 with a contribution of 15.10% to the total newly registered, which is then followed by Region IV with 12.62% contribution.
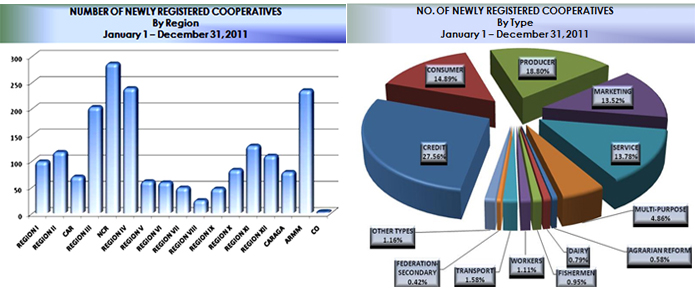
The high number of registered cooperatives in most of the regions for the year 2011signify that cooperatives are gaining recognition especially in regions with high rate of poverty like ARMM.
27.56% of cooperatives registered in 2011 are credit cooperatives. The Producers Cooperatives came in next with a total percentage of 18.80%. However, Marketing Cooperatives have the highest increase in growth rate posting 34.75% increase compared to 2010 newly registered coops.
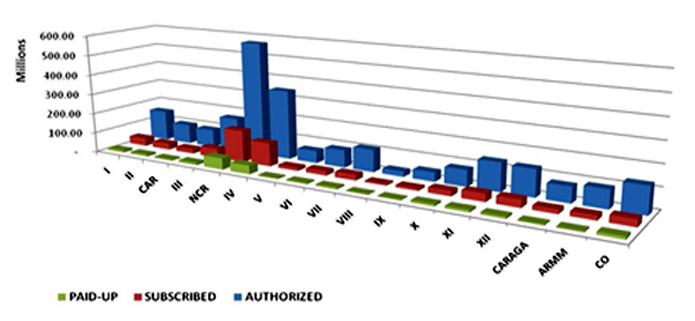
Capital Structure of Newly Registered Cooperatives
The 2011 newly registered cooperatives’ Authorized capital amounted to 2.4 Billion Pesos, 28.29% of which was subscribed by the cooperatives and 32.5 % has been paid by the cooperative members.
Membership of Newly Registered Cooperatives
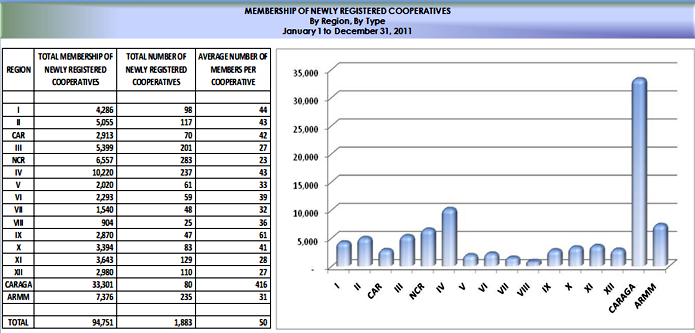
The newly registered cooperatives generated a membership of 94,751, which is 0.95% higher than 2010.
1 Electric Cooperative in CARAGA registered with CDA in 2011 which contributed for the regions high membership generation.
Total Number of Registered Cooperatives
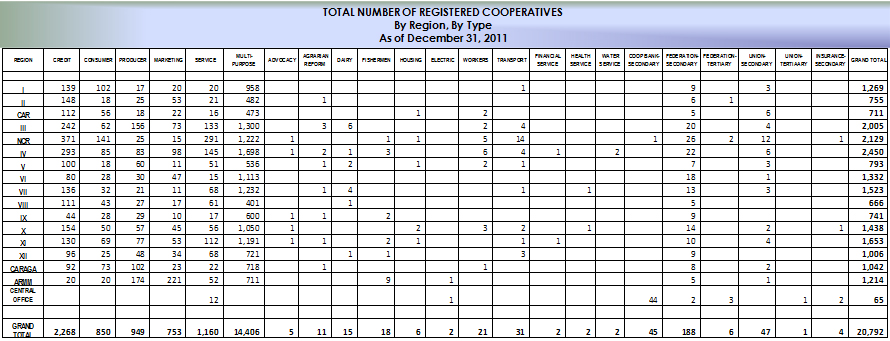
There are a total of 20,792 cooperatives registered in the Philippines as of December 31, 2011. It increased by 12.49% as compared to the previous year.
Region 4 has the most number of cooperatives with a total of 2,450 registered cooperatives.
ARMM has the highest growth rate from 2010 to 2011 projecting a 41.5% increase in the total number of registered cooperatives.
Meanwhile, the type of cooperative which has the highest growth rate in 2011 is the Marketing Cooperatives, with growth rate of 105.74% compared to 2010.
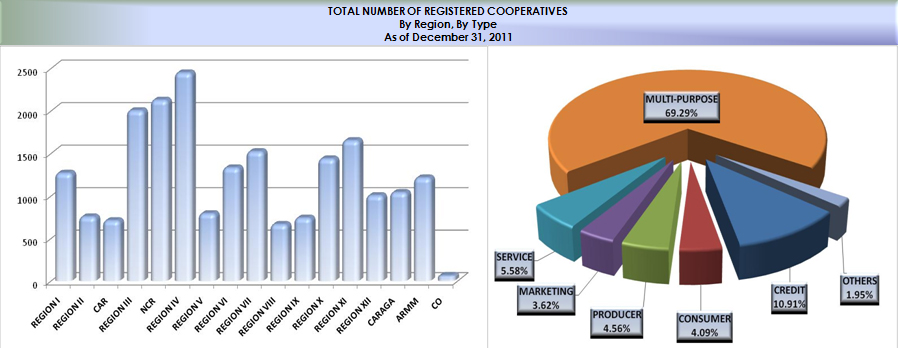
Region IV contributed 11.78% to the total registered cooperatives as of December 31, 2011. NCR came in second with 10.24% contribution, followed by Region III with 9.64%.
Multi-purpose cooperatives dominated the total number of registered cooperatives contributing 69.29% of the total. It is followed by credit cooperatives which comprises 10.91% of the total registered and the remaining 19.80% are distributed among other types.
Total Assets of Cooperatives
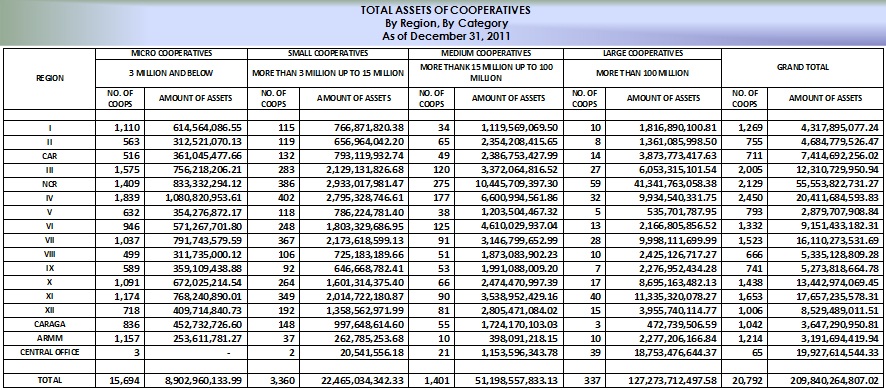
Of the 20,792 total registered cooperatives, the total cooperative assets amounted to 209.8 Billion Pesos as of Dec. 31, 2011, 60.7% of which large cooperatives assets, 24.4% are assets of medium cooperatives, 10.71% from small cooperatives, and 4.24% from micro-cooperatives.
In 2011, approximately 5.71% of Medium-Size Cooperatives have advanced into Large Cooperatives, 6.01 of Small-Size Cooperatives have advanced into Medium-Size Cooperatives, and 2.84 % of Micro-size Cooperatives have advanced into Small-sized Cooperatives.
Number of Cooperatives vs Assets
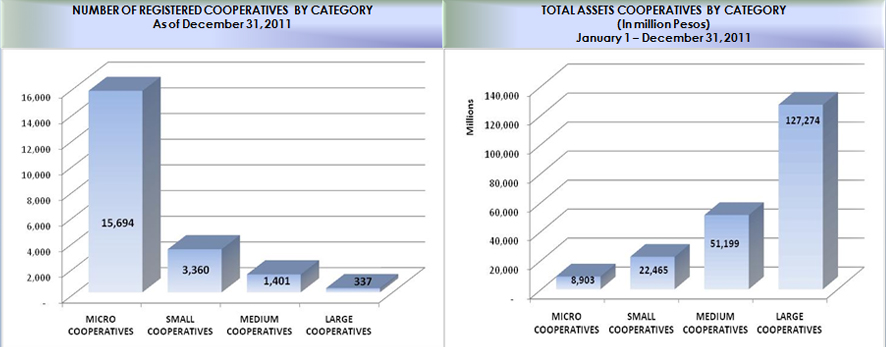
75.48% of the total registered cooperatives are categorized as micro-enterprise, 16.16% are categorized as small-enterprise, 6.74% are categorized as medium-enterprise and only 1.62% categorized as large-enterprise
In terms of enterprise category, the relationship between the number of cooperatives and the total assets is inversely proportional.
The average asset of a micro cooperative is Php 567,284, Small cooperatives have an average asset of PhP 6.7 million, medium cooperatives have an average asset of PhP 36.5 million, and large cooperatives have an average asset of PhP 378 million.
Cooperative Members vs. 2007 Philippine Populations
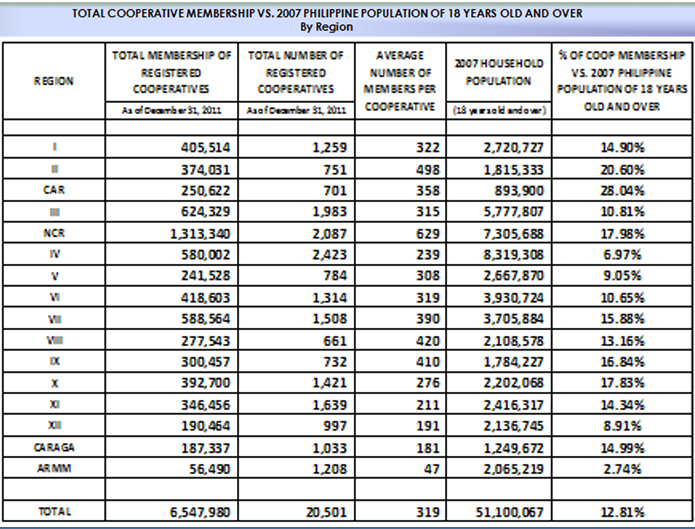
Source: www.census.gov.ph
Note:
* Excluding Secondary and Tertiary Cooperatives
* Membership of Primary Coops Registered in the Central Office are distributed in their corresponding regions of operation

Approximately 12.81% of Philippine household population of 18 years old and over are cooperative members. The cooperative membership saturation is highest in Cordillera Administrative Region, followed by Region II.
Meanwhile, NCR contributed 20.06% to the 2011 Total Cooperative Membership.
Employment Generated by Cooperatives
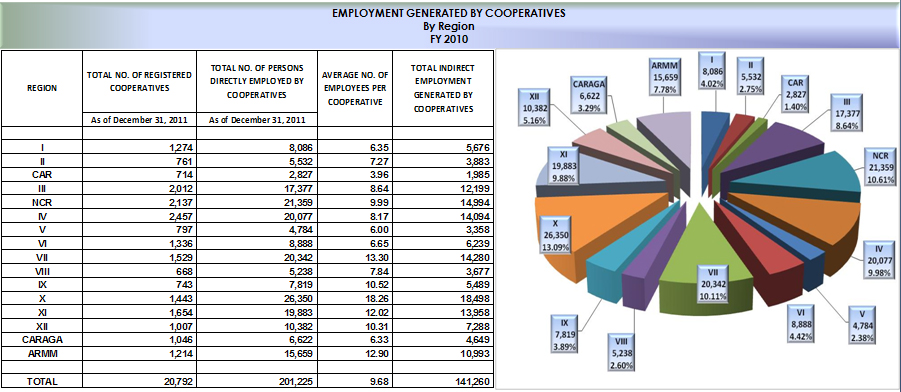
Sources: www.nwpc.dole.gov.ph | NSCB Sector Inverse Matrix
Cooperatives generated a total of 201,225 direct employment in 2010. Using the Sector Inverse Matrix (Input-Output Table) provided by the National Statistical Coordination Board (NSCB), a total of 141,260 indirect employment was derived.
NCR continued to contribute the largest share of 10.61% to the total direct employment generated by cooperatives.
2010 Cooperative Contribution to Gross Regional Domestic Product
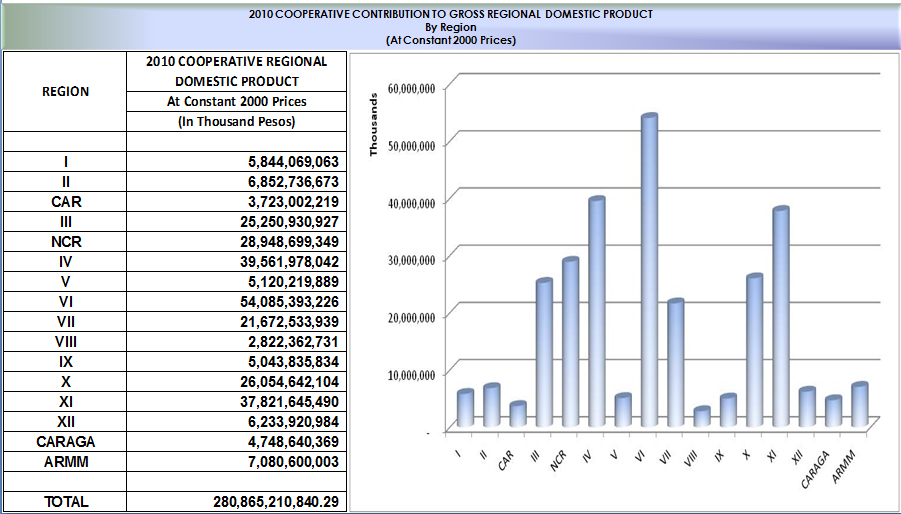
Source: www.nscb.gov.ph
The entire cooperative sector in the Philippines contributed 3.12% to the 2010 Gross Domestic Product.
The average per capita contribution of cooperatives to its members is PhP 3,574.45/coop member/month.

